Pro Forma Income Statement Template – Dumbing It Down
I always find the name income statement to be odd. To me, the name sounds like it’s just tracking revenue, when in actuality, it tracks income and expenses over a specified time period. This time around, I’m going to cover the income statement, like the balance sheet, I’m including a pro forma income statement template for your use. As I mentioned in the post on balance sheets, Pro Forma is just another way of saying you’re providing the data as a courtesy. Other names you might hear the income statement called are profit and loss (P&L), revenue and expenses, or comprehensive income. So, let’s get to it.
The income statement I’m going to show you today has 3 parts: Revenue, Expenses, and Net Profit (or Loss). Since there are quite a few variables to the income statement, I’ll also be providing a fully completed sample income statement, so you can see how it all fits together. I often seem templates with a summary for a year. However, I like to see what’s going on for 12 months at a time, so that’s what I’m providing in the template I created for you.
Please note, there is a summary tab and a 12-month tab you can select at the bottom of the worksheet. Only fields in green are editable in the template. The sample is for informational purposes only and not editable.
Revenue refers to the money your company brings in. It come in a variety of sources, such as interest, product and/or service sales, dividends (if your company owns stock), donations, or other forms. You’ll notice the revenue in my example rises gradually. This is based on the assumption that business will start off slow, but increase as the business becomes more well known. This isn’t the only model though. Some businesses are seasonal. For example, there’s a tourist town in my area that has a tourist season from May through September. Many of those businesses make all their money in 5 months and are closed for the rest of the year. Another example might be a ski company. They might make the bulk of their sales during fall and early winter, but see sales start to trickle toward the end of winter. Sales may continue through the year, but at a slower pace.
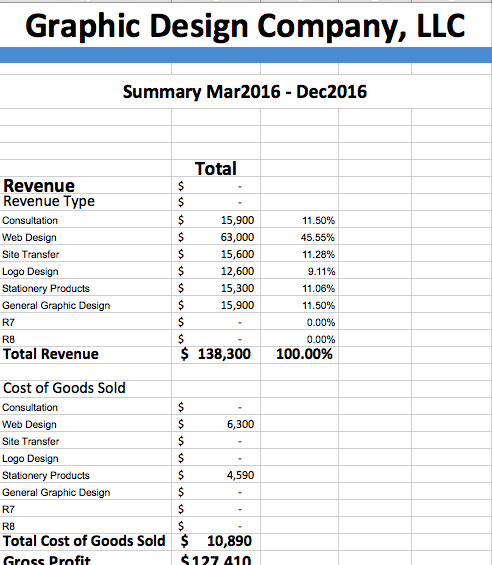
Revenue Type. I like to divide revenue into subcategories, as it provides a better understanding on which products and services are producing the revenue. For instance, the example I’ve provided as a download shows 46% of sales coming from web design services, whereas logo designs only make up about 9% of sales.
Cost of Goods Sold (COGS). COGS is more of an expense. However, I like to keep it close to revenue because of the close relationship. COGS refers to your wholesale cost or the cost for obtaining a product for resale. In the example, you’ll see the COGS for a website is 10%. This might include premium themes and plugins, the cost to register the domain, or even the cost to purchase a hosting package. You’ll also see COGS for the stationary supplies. This might include the cost to purchase the stationary prior to adding any graphic design to it. You calculate COGS percentage by taking your cost to obtain the product and dividing it by the retail price. In column B, you’ll see percentages next to the COGS. This is where you’d put your COGS percentage for each revenue type. Below is the formula for COGS.
COGS percentage = costs/sale price
Let’s use the example for the web design. According to the example, the company is charging $1500 for website design and the average cost to purchase the theme and plugins, register the domain, and purchase a hosting package is $150. Therefore, the formula would be:
COGS percentage = $150/$1500 = 10%
Gross Profits. In the template, the gross profits are calculated automatically for you. However, if you want to do the calculations on your own, they’re derived by taking the total revenue and subtraction the COGS.[fusion_code]Jmx0O3NjcmlwdCB0eXBlPSZxdW90O3RleHQvamF2YXNjcmlwdCZxdW90OyBzcmM9JnF1b3Q7aHR0cHM6Ly9zdGF0aWMubWFpbGVybGl0ZS5jb20vZGF0YS93ZWJmb3Jtcy82MzI0NjQvdjduOGoyLmpzP3YyJnF1b3Q7Jmd0OyZsdDsvc2NyaXB0Jmd0Ow==[/fusion_code]
Expenses
The next part refers to the expenses. It’s important that you capture as many expenses as possible, if not all the expenses your company will have. When I think of over and underestimating, this is an area you don’t want to underestimate. I typically tell clients it’s okay to add a little for the unexpected in the expense section. Here’s the reason why. Let’s say your underestimate your revenue but end up taking in more. You’re good to go. You’ve had a higher profit. Let’s say on the other hand, you underestimate your expenses. If your profit margin is tight, you may not have enough to revenue to cover your expenses. The opposite is true for revenue, where you want to avoid overestimating profits.
Like the revenue types, I also break down the expenses into separate categories, for similar reasons. You’ll see the first expenses are related to employees. You’ll also find percentages next to some of them. Though I made the numbers up for the example, you’ll want to contact the organization related to job services for more accurate percentages.
Variable employees are also listed as an expense. Typically variable employees are the part-time employees, who only receive hours as needed. Though you can do a hard entry for the amount you’ll budget for variable employees, I used a percentage of the sales revenue. You’ll also see a percentage for commissions. When you use the template, I want you to feel free to modify the formulas to meet your need. The formulas I provide are just to guide you.
One particular expense I want you to be aware of is bad debt. Unless you run an all cash system, there’s a chance you will have some bad debt. There are ways you can reduce your bad debt and possibly even eliminate it. However, I always like to put a little something in there for padding. As you work your way through the rest of the expenses, I want you to keep in mind that some expenses are monthly while others may be annually, semi-annually, bi-annually, etc. When you start working the cash flows, it’s important that you identify the different payment schedules for expenses.
Toward the bottom of the expenses, there’s a a place for depreciation and amortization. Depreciate happens when a company buys an asset and reduces the value of the asset over time. Amortization comes into play if you take out a business loan. You’ll include your loan payments on that line.
That pretty much sums up the expense section. Let’s look at the last piece.
Net Profit (or Loss)
This is what I like to call the bottom line… the moment of truth when you find out if you’re profitable or not. You’ll notice a few line items here: the Net Profit Before Tax, Quarterly Income Tax, and Net Income. I’ll cover each of these line items separately.
Net Profit Before Tax. This is a simple calculation. You’ll obtain the number by subtracting the total expense from the gross profit.
Net Profit Before Tax = Gross Profit – Total Expense.
That’s it. But why is it important to calculate the net profit before taxes? The main reason is it shows a company’s ability to generate income without the tax burden. The tax burden varies amongst different companies. So removing the taxes allows for a better comparison of a company’s potential. Simply put… its helpful to investors.
Quarterly Income Tax. I chose to calculate the taxes quarterly, using the IRS tax schedule. I won’t be going into income tax in detail for several reasons. 1) The tax code too vast for me to comprehend. 2) I’m not an accountant or CPA. 3) I’d hate to lead you in the wrong direction. So, check with your accountant or tax professional for details on when, how, and where to pay your taxes.
With that said, one thing you’ll notice is I calculated to not pay taxes when there was no income. Please take special note. Even if there are no taxes to pay, the IRS still requires you to file taxes (quarterly). Not filing on time can result in a penalty.
Net Income. Last but not least, we hit the net income. This can be a loss, as you see during the first few months, or a profit, as shown toward the end of the year. It’s calculated by subtracting the income tax from the net profit before tax.
Net Income = Net Income Before Tax – Income Tax
And there you have it. You’ve got a balance sheet and now the income statement. Pretty soon, you’ll have completed your entire financial projections.
Hi. I found your post on Income Statements very interesting. I have tried to set out my income and expenses in order to find out if I need to increase charges for my services. I am going to download your statement and start filling it out for the previous year and hopefully this will help me get my business back on track. What did you mean by adding something for padding with bad debts?
Great question, Christine. If you accept checks, offer lines of credits, or any other type of receivables, it’s a good idea to assume a certain amount of your revenue as bad debt. Bad debt refers to services you render but will never get reimbursed for because the buyer never came through. Sometimes people don’t consider checks as a receivable, but it is. Why? Because you never know if the check is going to be good until it clears. If it doesn’t clear, you have to collect on it (which can take time and/or money) or it can go into bad debt. Often businesses extend lines of credit. Again, there’s always the chance a business or individual won’t pay off their line of credit. So, when I say padding, really I’m talking about designating a certain percentage as potentially panning out as bad debt.
In terms of changes your prices, I encourage you to play around with the break even analysis calculator. A lot of business have a lot of anxiety over raising prices. However, you might find it interesting what your break even point will be if you raise prices, stay the same, or even lower prices.
Often times when revenue goes down, owners tend to lower prices to expand their reach. However, they fail to realize how much much more they’d have to turn in business by lower the price. On the other hand, raising the price may mean fewer customers, but the increased profit margin often more than makes up for it. If you have any questions while working through the worksheet, I’d be happy to answer them to the best of my knowledge.
omg! This is soooooo useful. Honestly, I was trying to get something that I can use for so long (at least in one place). There are many random templates online and they are all in different format. So these are real good. Thank you! SImple descriptions and definitions are what I need…..not a number crunching person unfortunately~
Thank you, Arcadiaecho. As I develop more templates, I’m trying to keep the same format. In the end, I hope entrepreneurs will be able to consolidate the templates they obtain from here to put together a set of financial projections.
Comments are closed.
Report
There was a problem reporting this post.
Block Member?
Please confirm you want to block this member.
You will no longer be able to:
See blocked member's posts
Mention this member in posts
Invite this member to groups
Message this member
Add this member as a connection
Please note:
This action will also remove this member from your connections and send a report to the site admin.
Please allow a few minutes for this process to complete.


Hi. I found your post on Income Statements very interesting. I have tried to set out my income and expenses in order to find out if I need to increase charges for my services. I am going to download your statement and start filling it out for the previous year and hopefully this will help me get my business back on track. What did you mean by adding something for padding with bad debts?
Great question, Christine. If you accept checks, offer lines of credits, or any other type of receivables, it’s a good idea to assume a certain amount of your revenue as bad debt. Bad debt refers to services you render but will never get reimbursed for because the buyer never came through. Sometimes people don’t consider checks as a receivable, but it is. Why? Because you never know if the check is going to be good until it clears. If it doesn’t clear, you have to collect on it (which can take time and/or money) or it can go into bad debt. Often businesses extend lines of credit. Again, there’s always the chance a business or individual won’t pay off their line of credit. So, when I say padding, really I’m talking about designating a certain percentage as potentially panning out as bad debt.
In terms of changes your prices, I encourage you to play around with the break even analysis calculator. A lot of business have a lot of anxiety over raising prices. However, you might find it interesting what your break even point will be if you raise prices, stay the same, or even lower prices.
Often times when revenue goes down, owners tend to lower prices to expand their reach. However, they fail to realize how much much more they’d have to turn in business by lower the price. On the other hand, raising the price may mean fewer customers, but the increased profit margin often more than makes up for it. If you have any questions while working through the worksheet, I’d be happy to answer them to the best of my knowledge.
omg! This is soooooo useful. Honestly, I was trying to get something that I can use for so long (at least in one place). There are many random templates online and they are all in different format. So these are real good. Thank you! SImple descriptions and definitions are what I need…..not a number crunching person unfortunately~
Thank you, Arcadiaecho. As I develop more templates, I’m trying to keep the same format. In the end, I hope entrepreneurs will be able to consolidate the templates they obtain from here to put together a set of financial projections.